
CLIENT_IMPACT
Client Impact
Every project here was built to solve a real problem, and each is told the way leadership reads it: Challenge → Solution → Business Outcome. Some are live systems clients use today. Some are experiments that deepened our understanding of AI's real limits. And some are prototypes that became the foundation of solutions we now deliver. All of them follow one chain — turn data into a trusted asset, lift the people who use it, change how the business runs, and put evidence in front of every decision. Built inside real Thai workflows, alongside real humans — not pitch decks.

Senior & Family AI Agent
tap for details
Senior & Family AI Agent
Seniors were unlikely to adopt a new app, so any support tool had to meet them inside the social platforms they already used daily.
Built an NLP-powered AI assistant delivered through existing social channels, helping with news, language learning, and companionship with minimal hallucination.
Outcome:Piloted with 150 family members, the AI caught early health and loneliness signals and increased how satisfied families felt with the interaction.
This experience serves as a friction gap study, identifying how to transition from traditional methods to using AI. The insights gathered will be used to design Fars-AI 'AI Introduction' course.

AI Beauty Agent (LINE LIFF)
tap for details
AI Beauty Agent (LINE LIFF)
A personal cosmetic inventory tracker only told users what they owned — it couldn't tell them what to actually do with it.
Embedded a conversational AI agent inside the existing LINE LIFF app that reasons over each user's real inventory data.
Outcome:Turned a passive tracker into a beauty advisor users could ask natural questions to, delivered natively inside the app they already use.
This experience pilots AI agent capabilities on top of personal inventory data—a pattern directly extensible to retail, health, and lifestyle verticals. Auth uses Supabase Edge Functions with LINE token verification and Row Level Security.

AI Leverage Workshop for SMEs
tap for details
AI Leverage Workshop for SMEs
SME owners and staff wanted to use AI but didn't know where to start or which tools actually fit their work.
Ran a hands-on workshop covering core AI concepts, the difference between assistants and generative tools, and live image-generation practice.
Outcome:Participants left with real use cases they could apply immediately at work and in daily life, not just theory.
This custom workshop is designed to be delivered in-person or online, and can be tailored to the specific needs of the participants.

E-commerce Sales Analysis Dashboard
tap for details
E-commerce Sales Analysis Dashboard
Leadership at the e-commerce platform could see sales totals but not which brands, categories, or days actually drove them.
Built a multi-view Power BI dashboard with trend, segment, and day-of-week/day-of-month heatmap breakdowns.
Outcome:Gave the team granular, data-backed visibility to make brand, channel, and customer-segment growth decisions with confidence.
Includes advanced filters: Brand Rank, Channel, Category Level 2, Business Type, Age, and Segment.
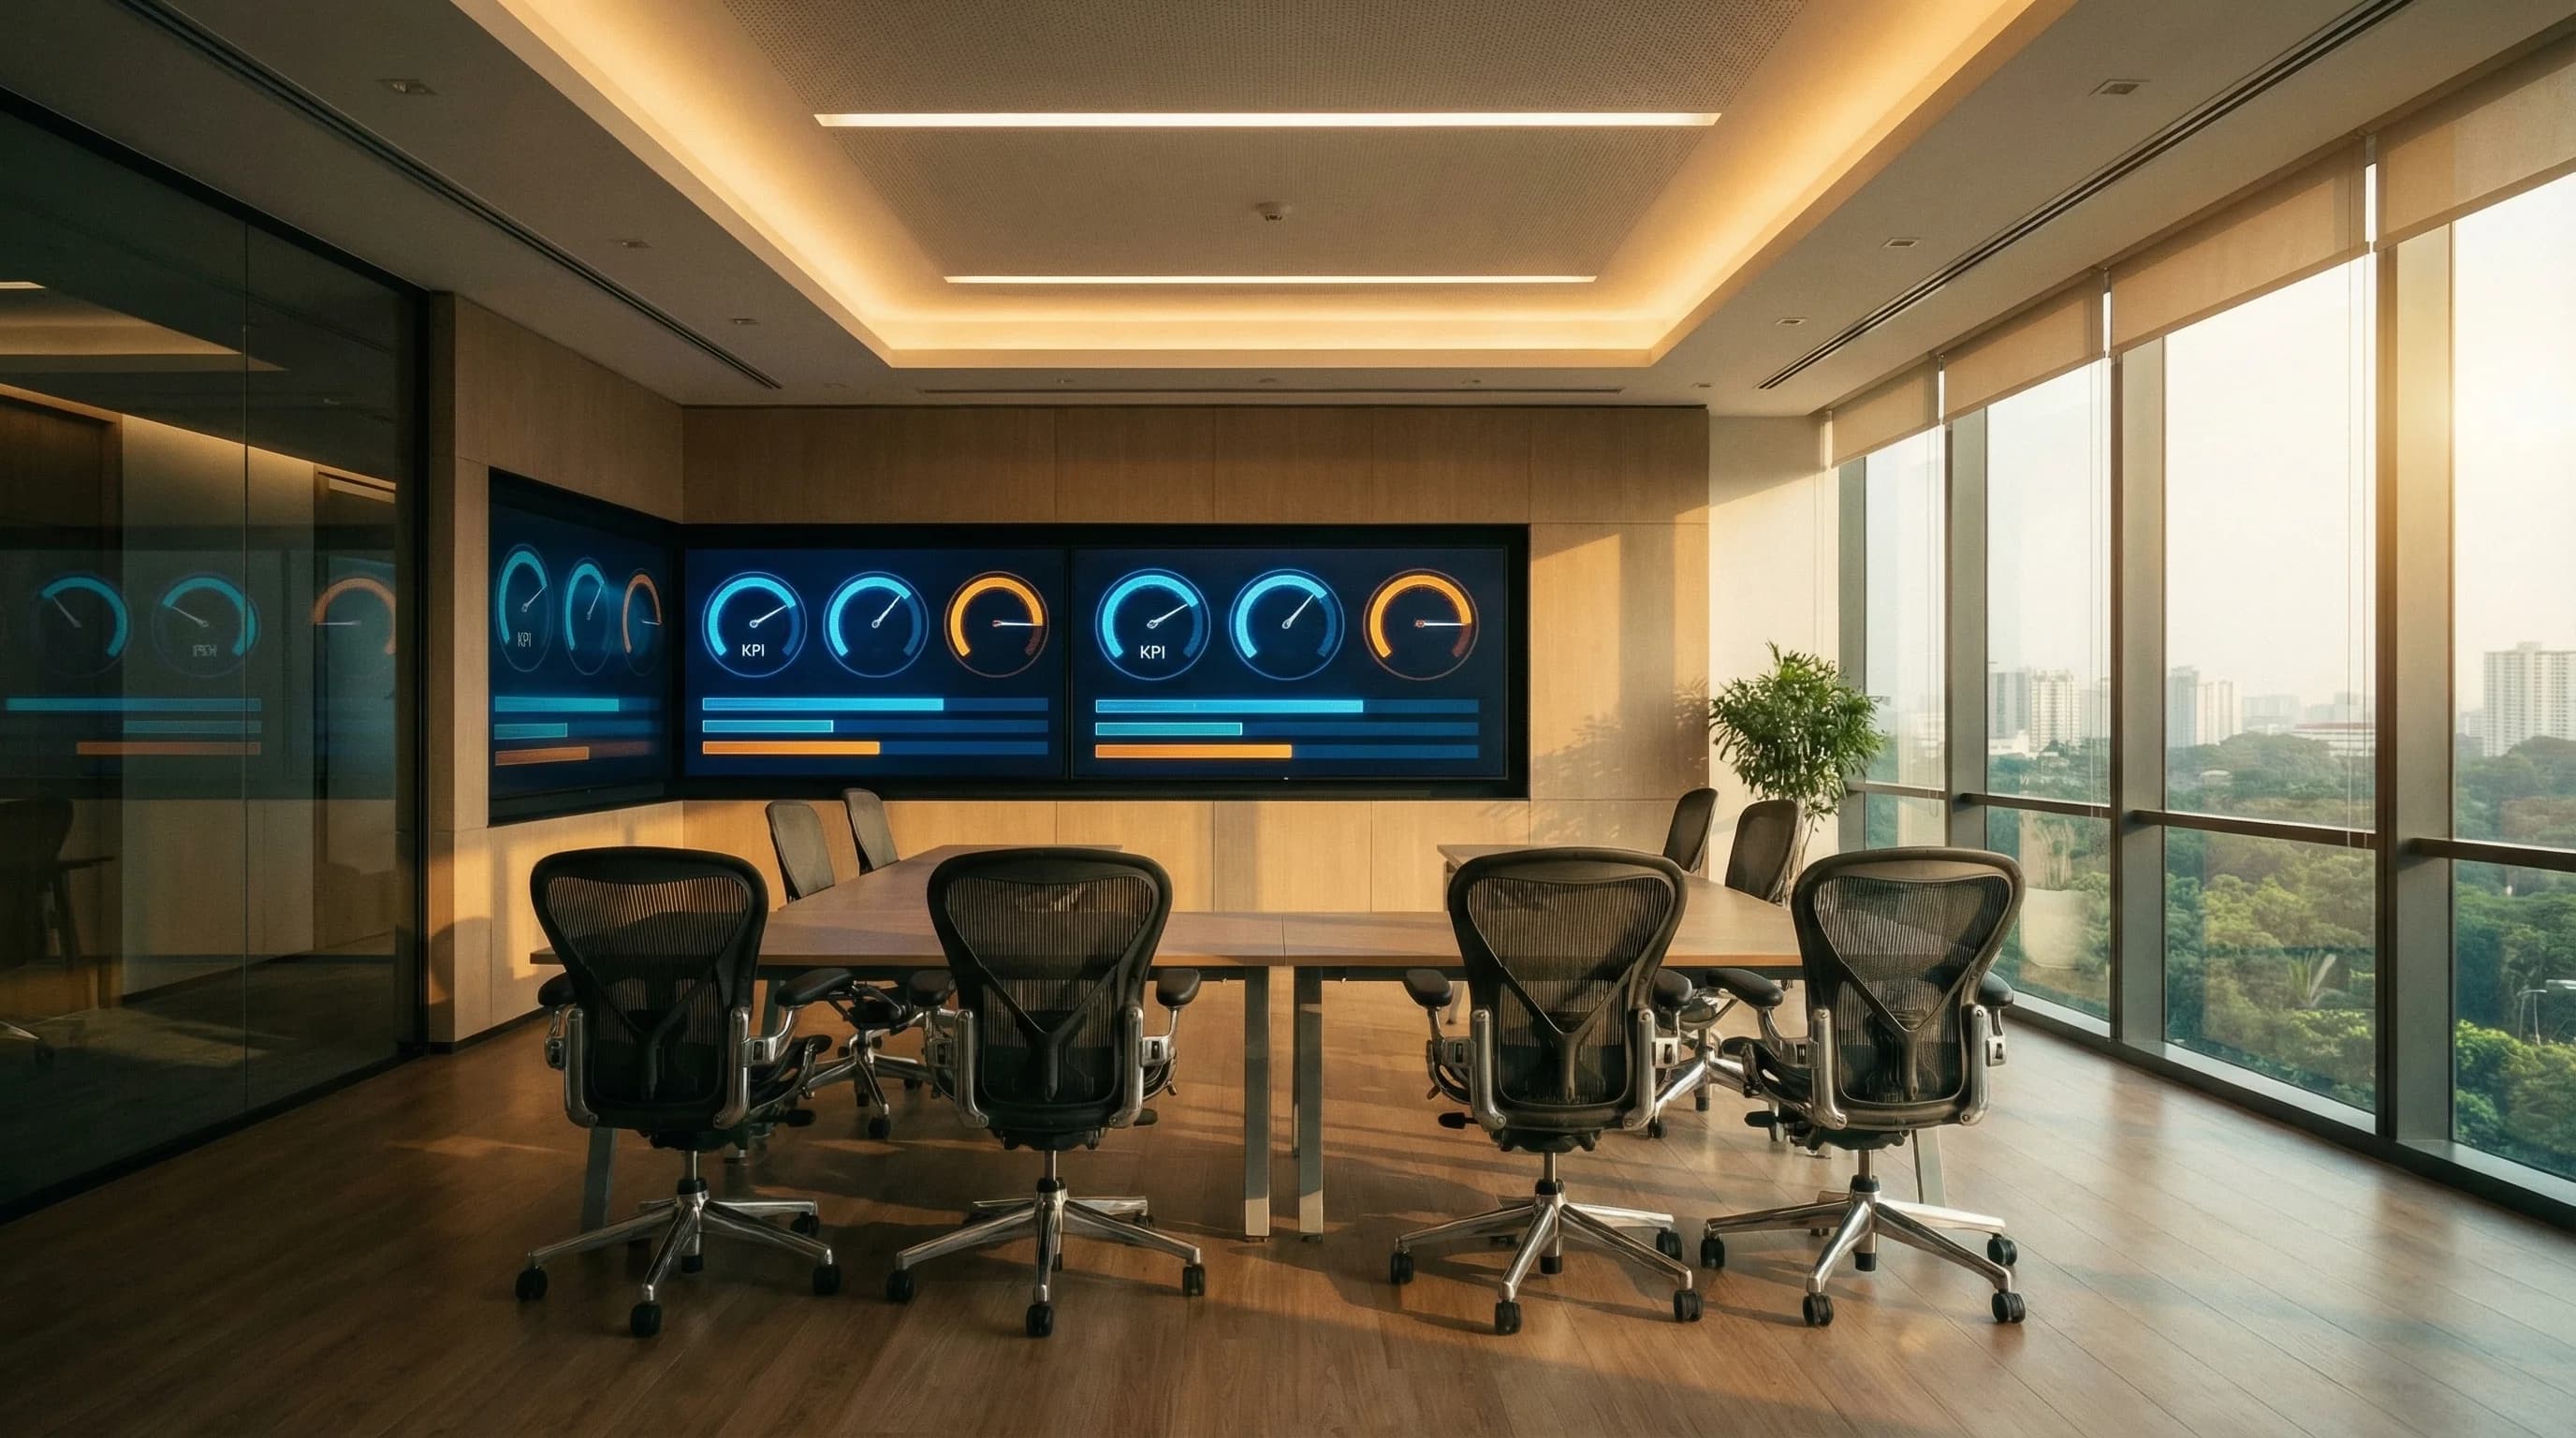
Sales vs Target Performance Dashboard
tap for details
Sales vs Target Performance Dashboard
Executives couldn't tell in real time which brands or sales offices were falling behind target until it was too late to react.
Built a Power BI dashboard that tracks actual sales against targets side-by-side with trend analysis.
Outcome:Let executive and sales teams spot underperforming segments by brand, company, and office, and respond faster.
Filters include Brand, Company, and Sales Office for granular drill-down.

Market Pattern Analytics (ML Insight)
tap for details
Market Pattern Analytics (ML Insight)
Spotting early signals of market movement in large historical datasets was too slow and manual for the team to act on in time.
Built a Random Forest-based ML pipeline that scans time-series market data for recurring patterns.
Outcome:Delivered a working prototype that flags potential investment opportunities from historical indices before they'd be caught by manual review.

FMCG Brand Customer Analytics Dashboard
tap for details
FMCG Brand Customer Analytics Dashboard
The brand didn't know which customers actually drove long-term revenue or how those relationships changed over time.
Built a customer-centric Power BI dashboard tracking lifetime value, top-customer ranking, and growth trends.
Outcome:Gave the client the data to run targeted retention strategies and identify its highest-value customer segments.

Executive Dashboard (Consulting Collaboration)
tap for details
Executive Dashboard (Consulting Collaboration)
Senior leadership had critical metrics scattered across multiple sources with no single view to guide decisions.
Co-developed an executive-facing Power BI dashboard with a global consulting partner that aggregates cross-functional KPIs into one view.
Outcome:Cut reliance on manual report compilation and sped up leadership's decision-making.
Collaborated with the consulting partner's team to align dashboard design with enterprise reporting standards.

Booking Insight LLM
tap for details
Booking Insight LLM
Leadership had 45,000+ meeting room booking titles but no way to see what they revealed about real business activity.
Built a Claude-API analysis tool that reads booking titles at scale and extracts patterns without manual review.
Outcome:Surfaced strategic focus areas and room-utilization recommendations that would have taken weeks of manual review to find.

Luxury Wellness Brand Sales Dashboard Revamp
tap for details
Luxury Wellness Brand Sales Dashboard Revamp
The brand's legacy sales reporting platform was slow and hard to read, and stakeholders had stopped trusting it.
Reverse-engineered the old data models and rebuilt the reporting platform as a modern, consistent Power BI dashboard.
Outcome:Improved stakeholder adoption and cut the time needed to pull retail sales insights.
Legacy system migration; required reverse-engineering of existing data models before redesign.

Petrochemical Conglomerate Sales & Marketing Dashboard
tap for details
Petrochemical Conglomerate Sales & Marketing Dashboard
Sales and marketing data sat in separate silos, so teams at one of Thailand's largest petrochemical conglomerates couldn't see a unified performance picture.
Built a Tableau dashboard that integrates sales and marketing data into one cross-departmental view.
Outcome:Let teams spot market opportunities and monitor commercial performance across product lines from a single report.
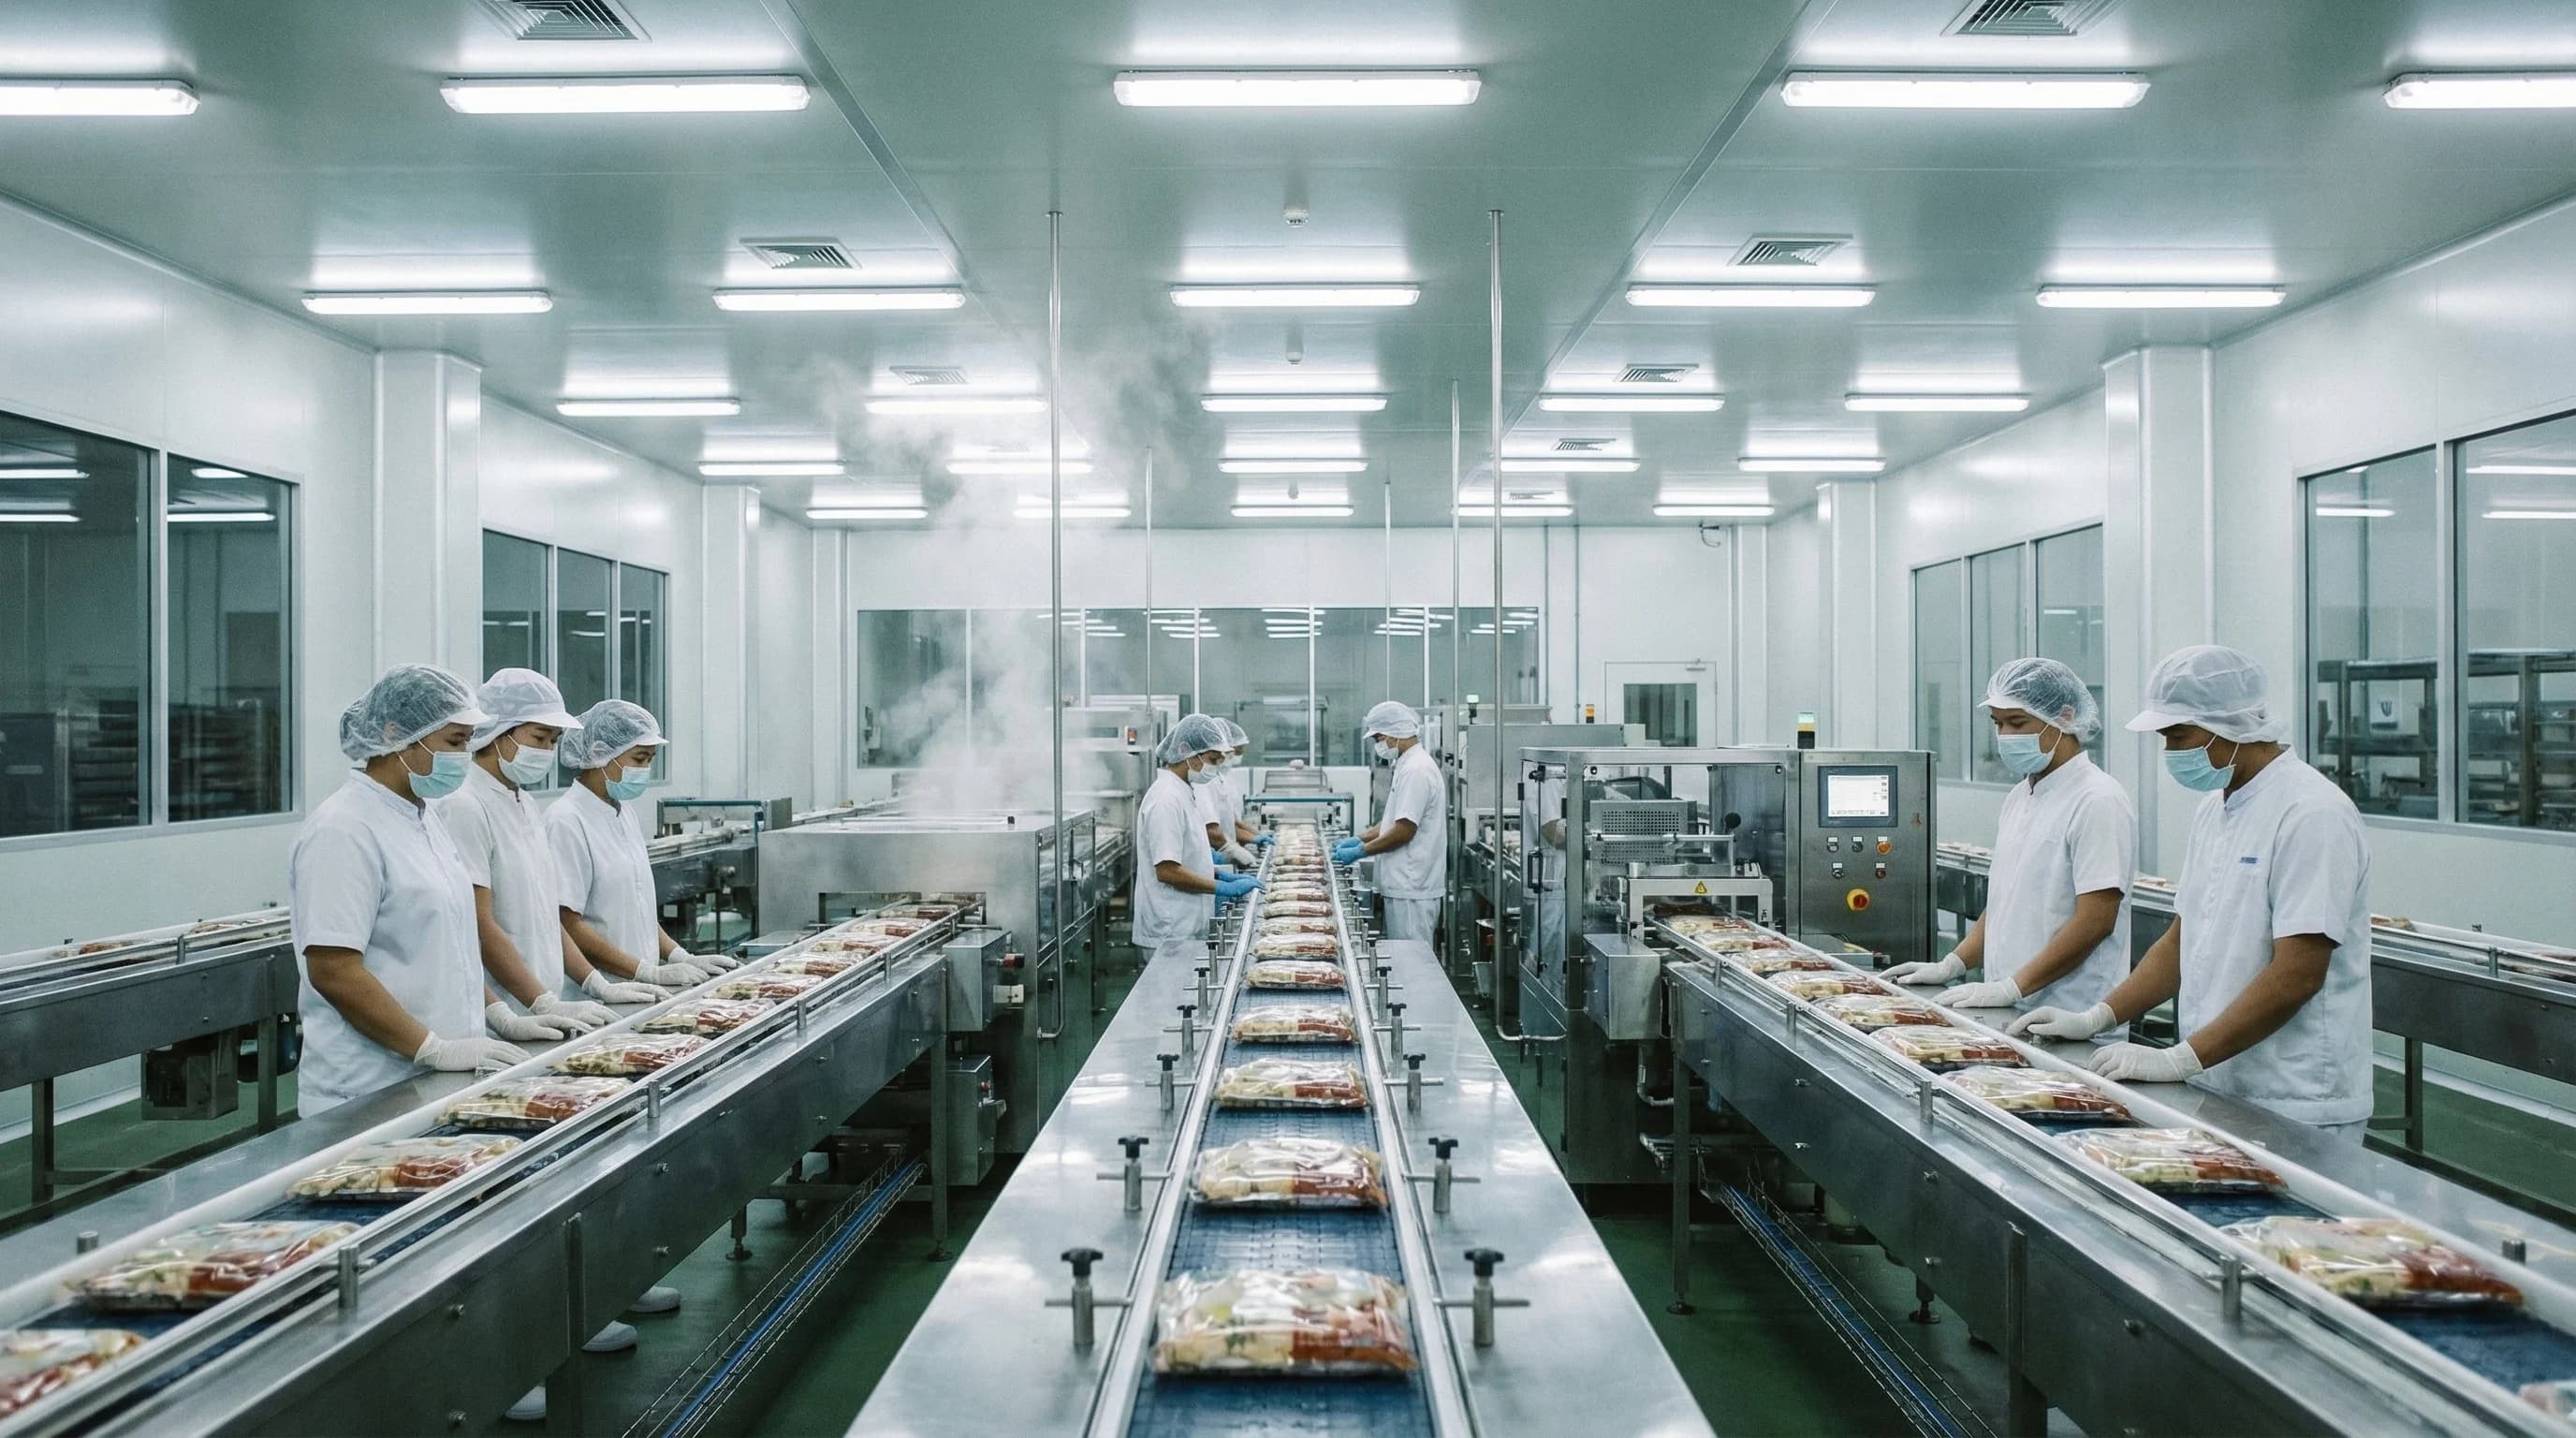
Food Production Group Process Analysis
tap for details
Food Production Group Process Analysis
Operations teams at the food production group couldn't see where bottlenecks were slowing down throughput on the line.
Built a Tableau dashboard analyzing production workflows and process-efficiency metrics.
Outcome:Helped operations pinpoint inefficiencies and back throughput and resource-utilization improvements with data.

Insurance Group Digital Marketing Report Transformation
tap for details
Insurance Group Digital Marketing Report Transformation
The marketing team was stuck rebuilding the same reports by hand in spreadsheets every reporting cycle.
Replaced static spreadsheet reporting with a live, self-service Tableau BI tool fed by a direct data pipeline.
Outcome:Eliminated the manual report-production cycle and gave marketing real-time access to campaign and channel performance.
Included designing a data pipeline to connect marketing platform exports directly into Tableau.
NEXT_STEP // 0x6e657874