CLIENT_IMPACT
ผลลัพธ์ลูกค้า
ทุกโปรเจกต์ที่นี่เกิดจากความตั้งใจแก้ปัญหาจริง และเล่าในแบบที่ผู้บริหารอ่าน: โจทย์ → ทางแก้ → ผลลัพธ์ทางธุรกิจ บางชิ้นเป็นระบบที่ลูกค้าใช้งานอยู่จริงวันนี้ บางชิ้นคือการทดลองที่สอนให้เราเข้าใจขีดจำกัดของ AI ลึกขึ้น และบางชิ้นเป็น Prototype ที่กลายเป็นรากฐานของโซลูชันในปัจจุบัน ทั้งหมดเดินตามห่วงโซ่เดียวกัน — เปลี่ยนข้อมูลให้เป็นสินทรัพย์ที่เชื่อถือได้ ยกระดับคนที่ใช้มัน เปลี่ยนวิธีทำงานของธุรกิจ และวางหลักฐานไว้หน้าทุกการตัดสินใจ — สร้างใน Workflow จริงขององค์กรไทย เคียงข้างคนทำงานจริง ไม่ใช่ในสไลด์ Pitch Deck

Senior & Family AI Agent
tap for details
Senior & Family AI Agent
ผู้สูงอายุมักไม่ปรับตัวรับแอปใหม่ ดังนั้นเครื่องมือช่วยเหลือต้องเข้าถึงพวกเขาผ่านแพลตฟอร์มโซเชียลที่ใช้อยู่แล้วในชีวิตประจำวัน
สร้าง AI Assistant ด้วย NLP ที่ส่งมอบผ่านช่องทางโซเชียลเดิม ช่วยอ่านข่าว ฝึกภาษา และเป็นเพื่อนคุย โดยมี Hallucination ต่ำ
ผลลัพธ์:นำร่องกับสมาชิกครอบครัว 150 คน AI จับสัญญาณด้านสุขภาพและความเหงาได้ตั้งแต่เนิ่นๆ และเพิ่มความพึงพอใจในการโต้ตอบของครอบครัว
This experience serves as a friction gap study, identifying how to transition from traditional methods to using AI. The insights gathered will be used to design Fars-AI 'AI Introduction' course.
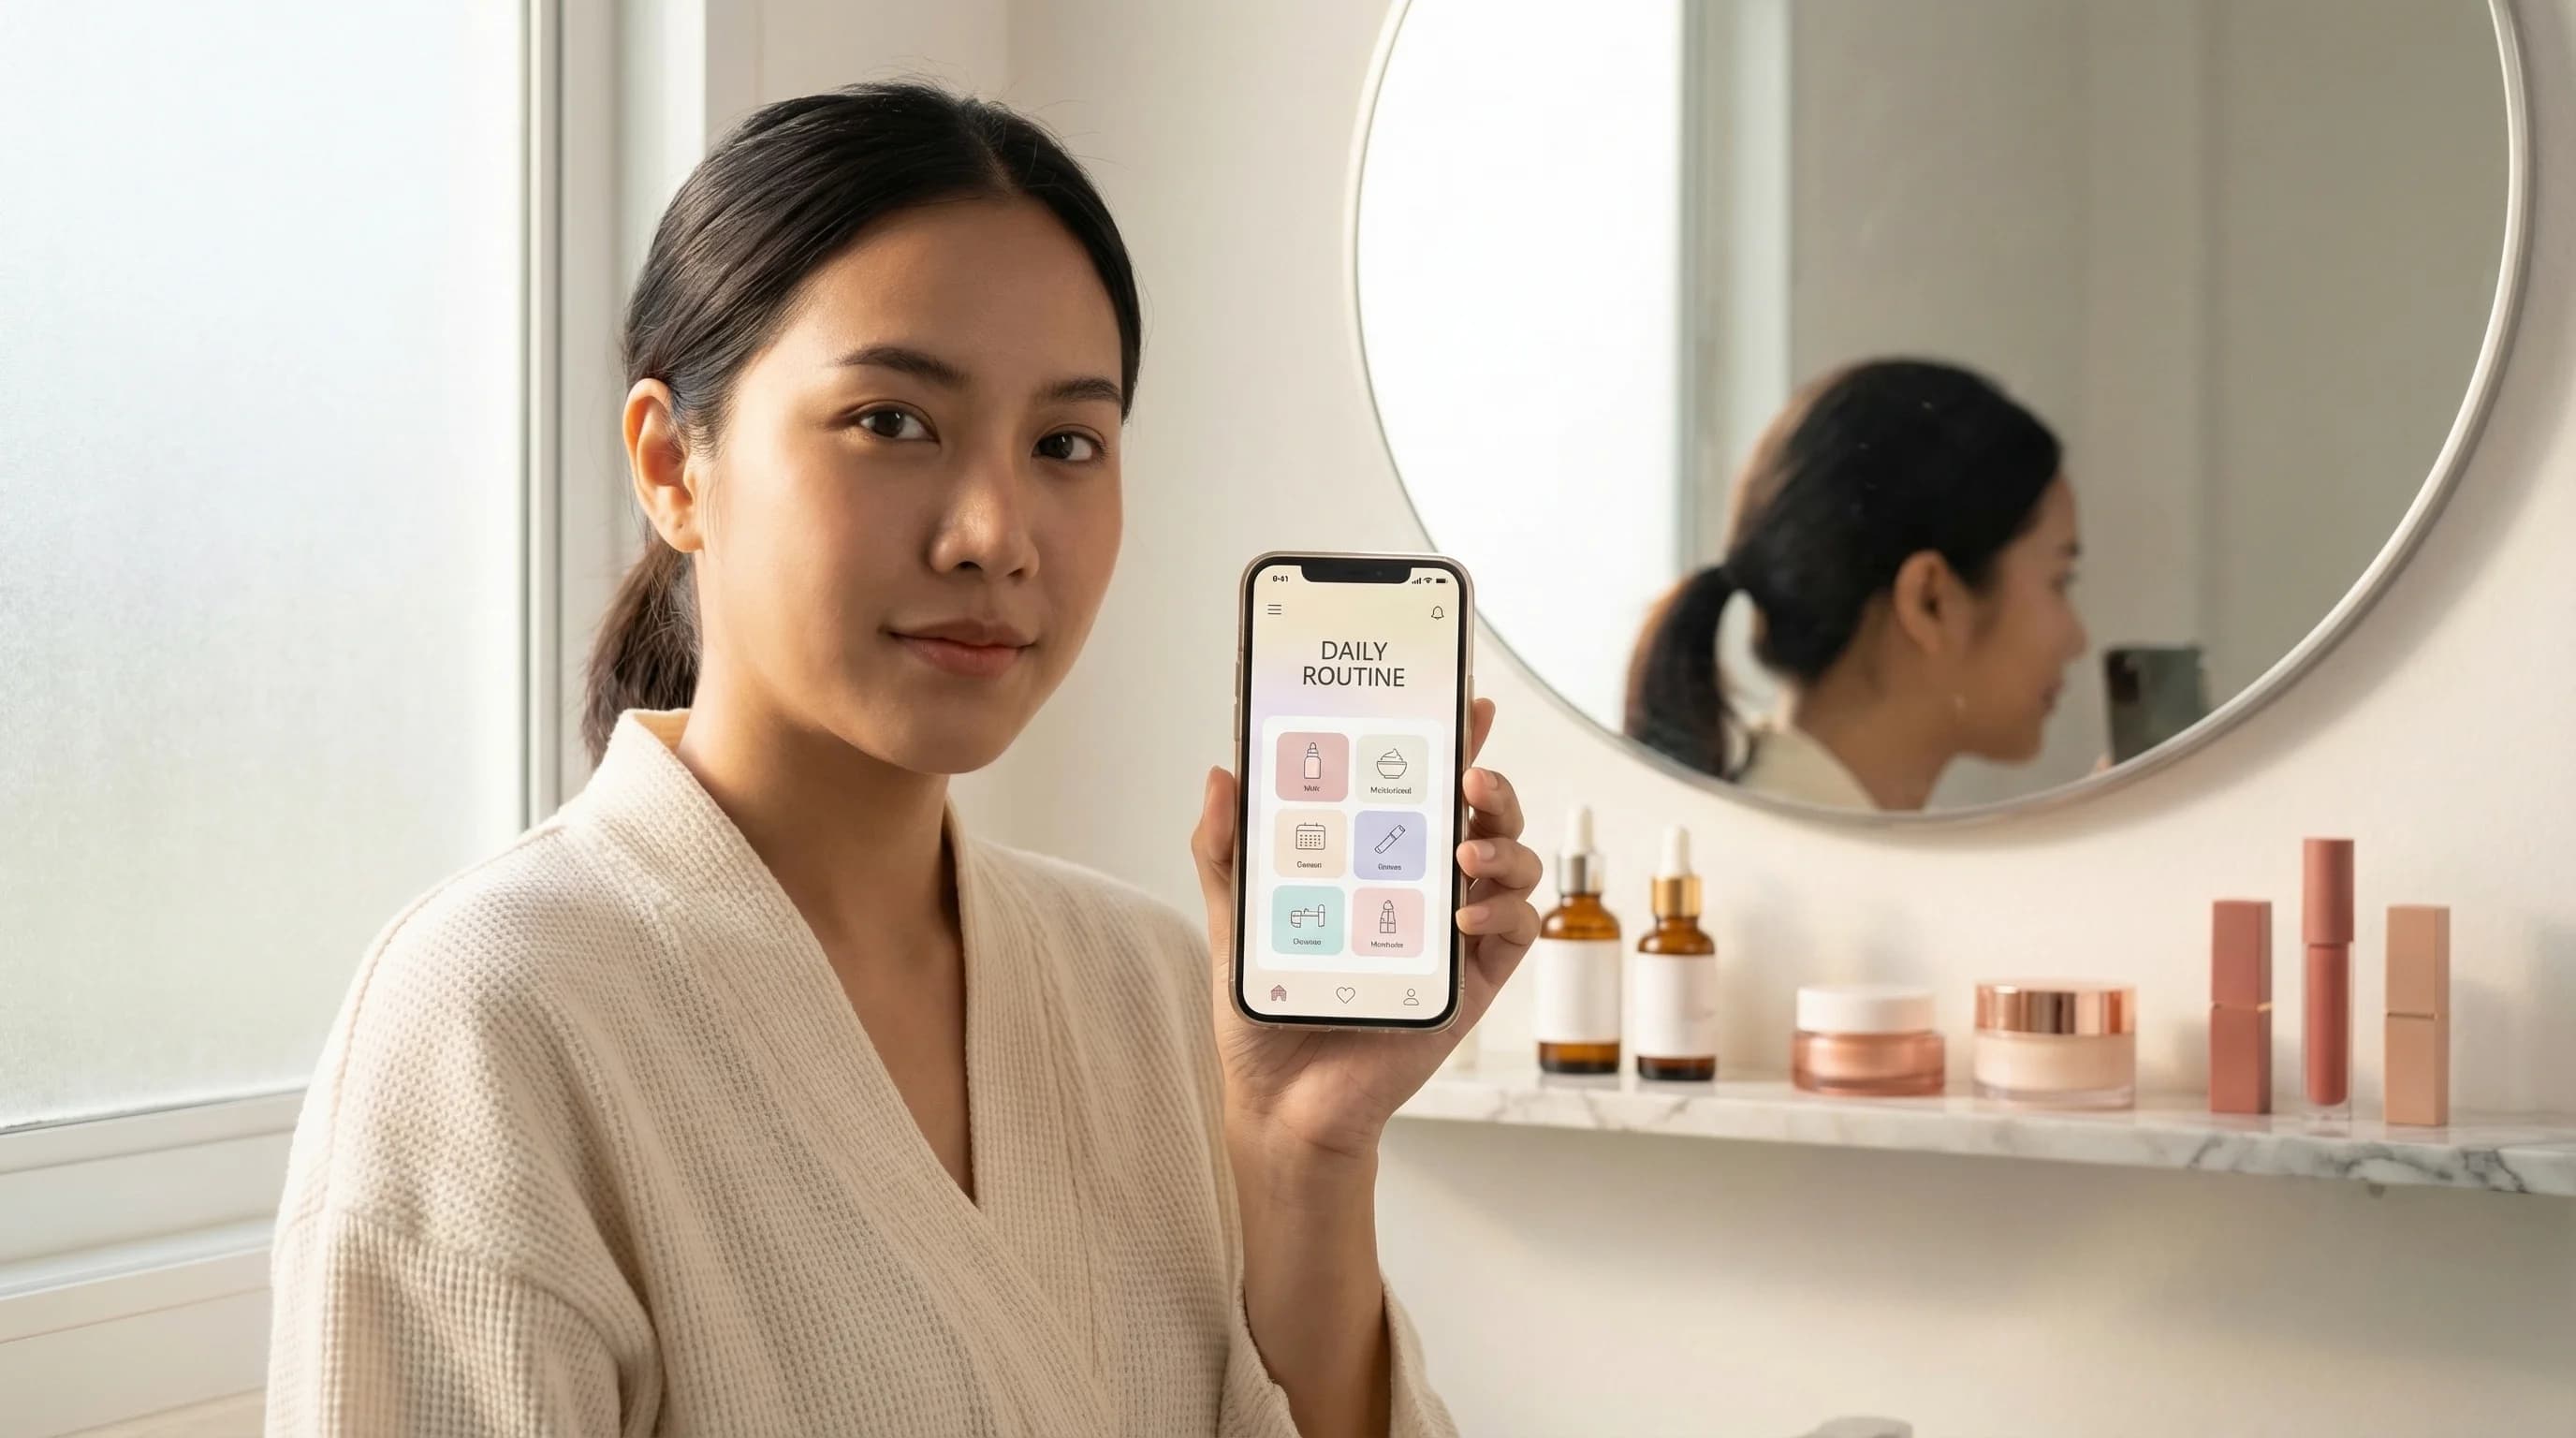
AI Beauty Agent (LINE LIFF)
tap for details
AI Beauty Agent (LINE LIFF)
เครื่องมือติดตามสินค้าคอสเมติกส่วนตัวบอกได้แค่ว่าผู้ใช้มีอะไรอยู่บ้าง แต่บอกไม่ได้ว่าควรใช้สิ่งเหล่านั้นอย่างไร
ฝัง AI Agent แบบสนทนาไว้ในแอป LINE LIFF เดิม ที่สามารถให้เหตุผลจากข้อมูลสินค้าคงคลังจริงของผู้ใช้แต่ละคน
ผลลัพธ์:เปลี่ยนเครื่องมือติดตามสินค้าแบบ Passive ให้กลายเป็นที่ปรึกษาความงามที่ผู้ใช้ถามคำถามได้ตามธรรมชาติ ส่งมอบอยู่ในแอปที่ใช้งานอยู่แล้ว
This experience pilots AI agent capabilities on top of personal inventory data—a pattern directly extensible to retail, health, and lifestyle verticals. Auth uses Supabase Edge Functions with LINE token verification and Row Level Security.

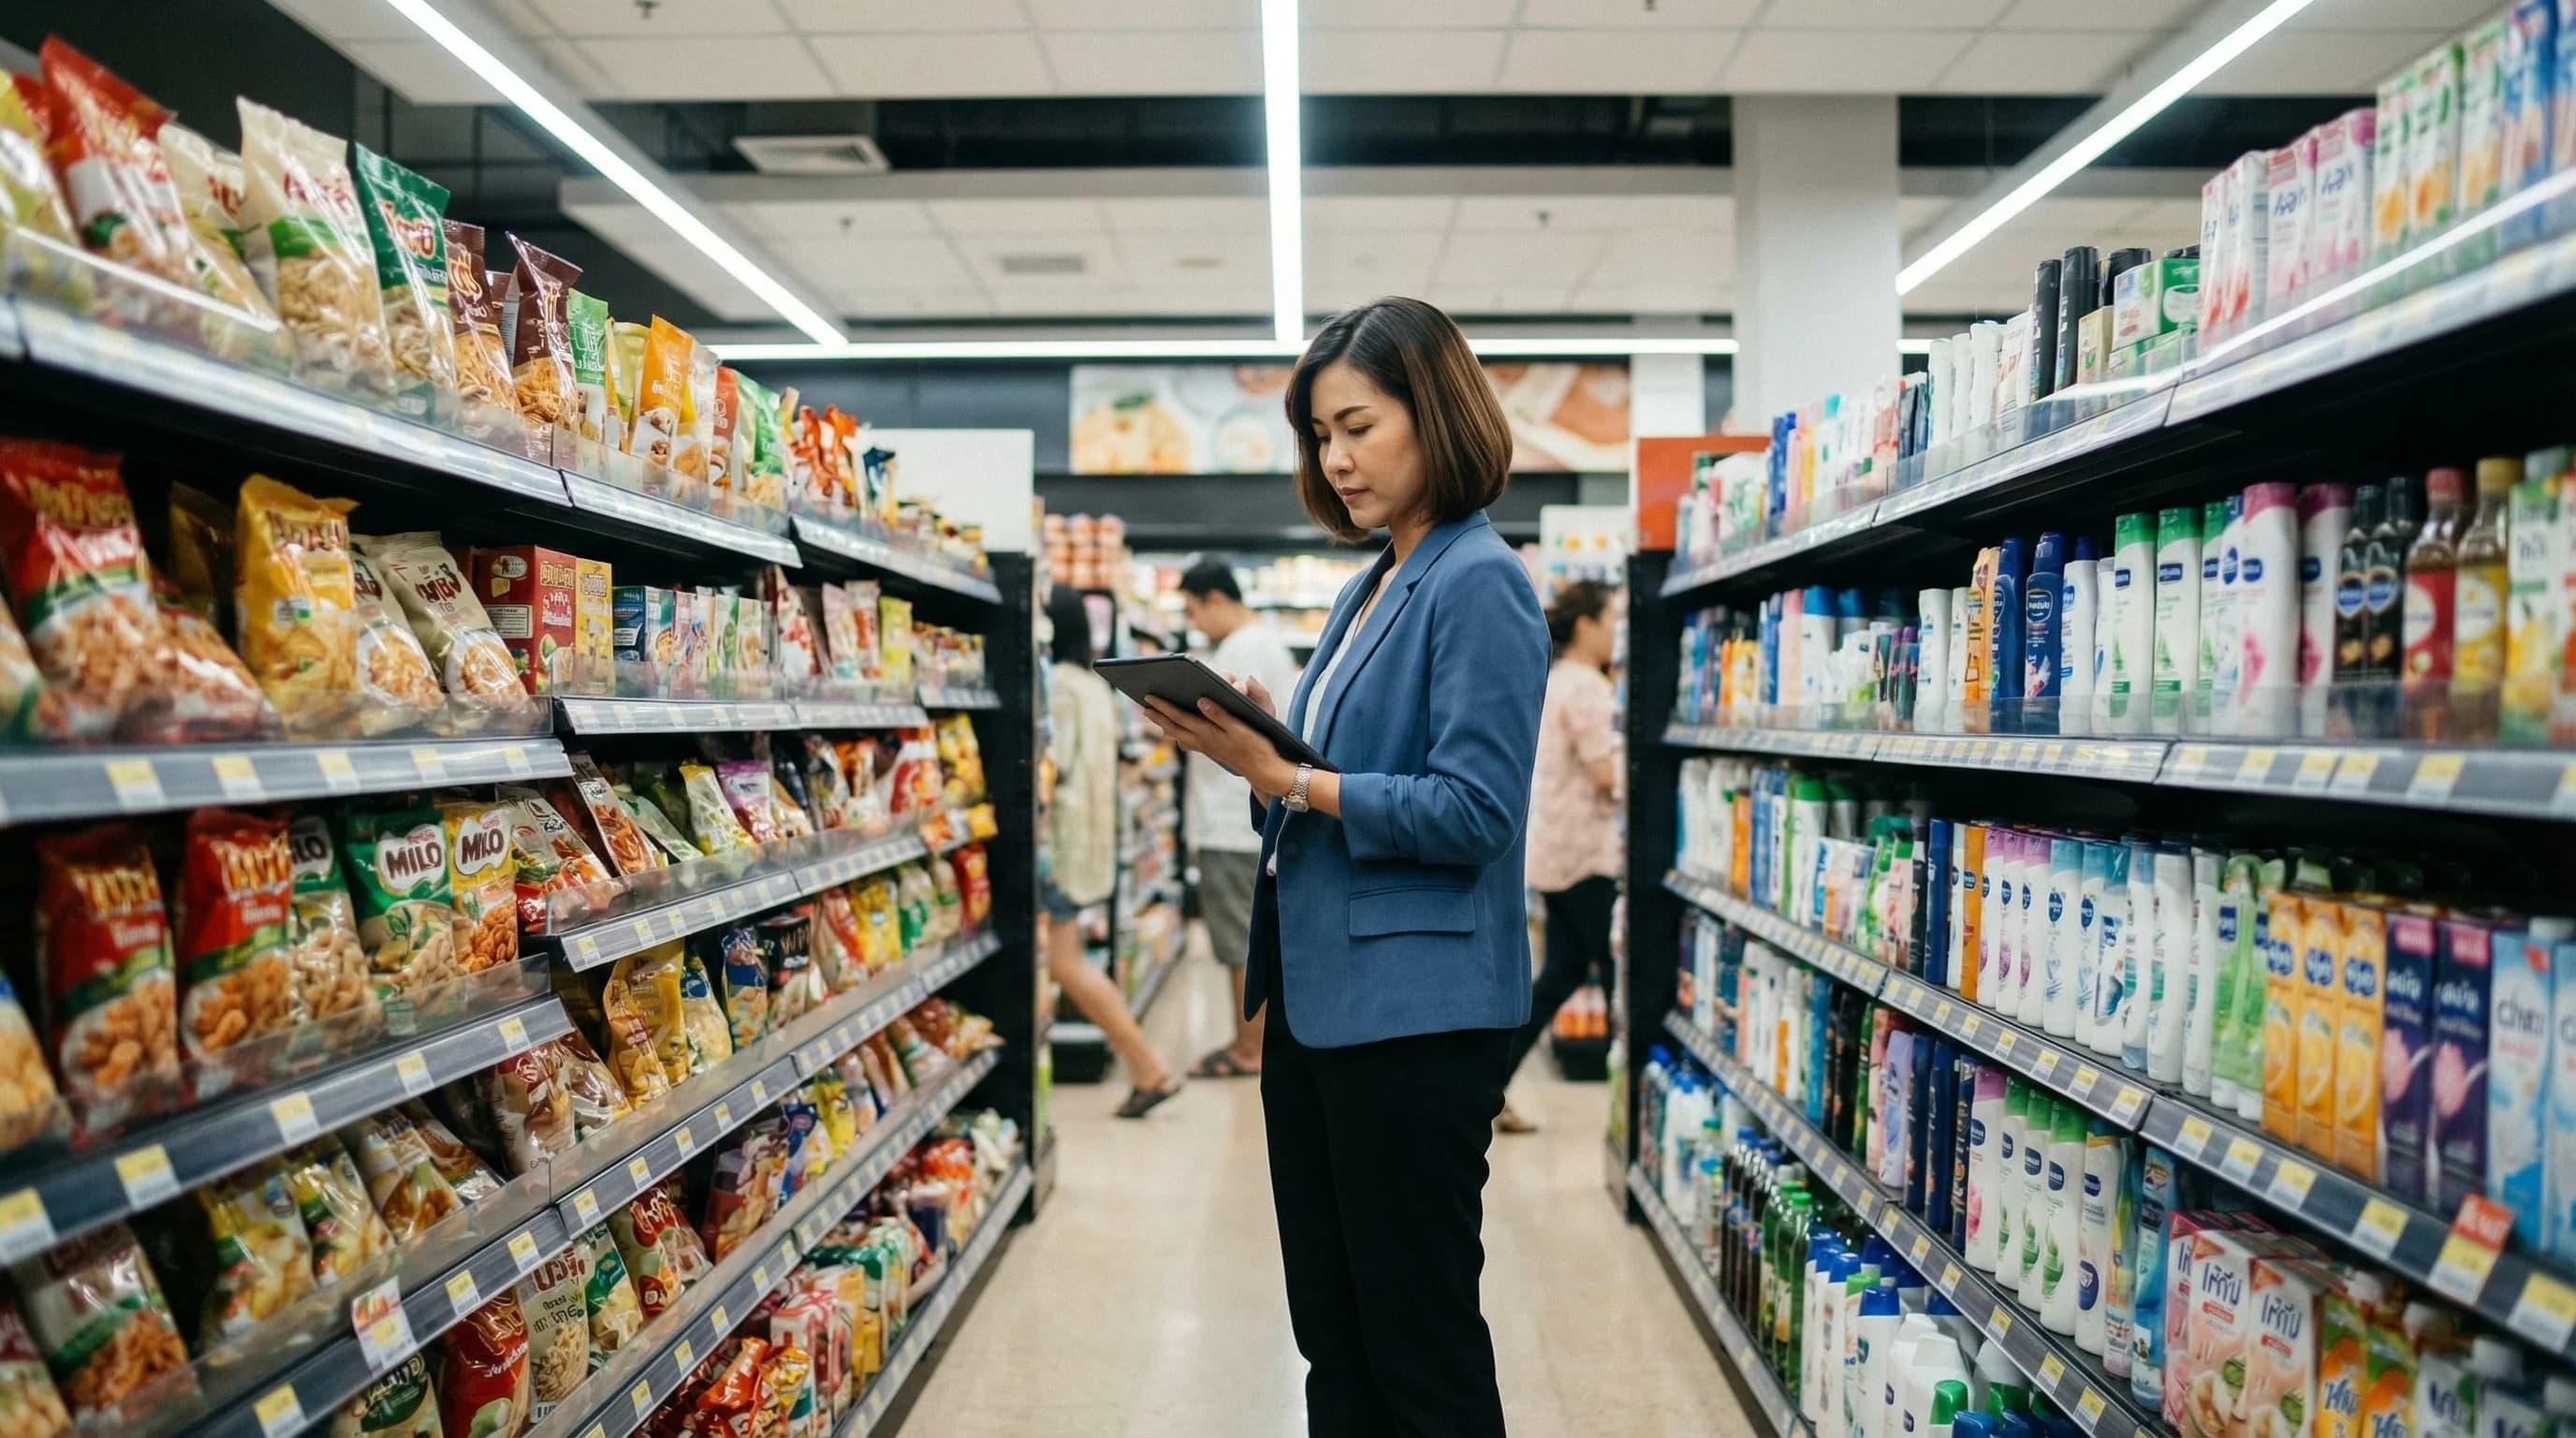
AI Leverage Workshop for SMEs
tap for details
AI Leverage Workshop for SMEs
เจ้าของธุรกิจ SME และพนักงานอยากใช้ AI แต่ไม่รู้จะเริ่มจากตรงไหนหรือเครื่องมือแบบไหนที่เหมาะกับงานของตัวเอง
จัด Workshop ลงมือทำจริง ครอบคลุมแนวคิด AI พื้นฐาน ความต่างระหว่าง AI Assistant กับเครื่องมือ Generative และฝึกสร้างภาพด้วย AI สด
ผลลัพธ์:ผู้เข้าร่วมได้ Use Case จริงที่นำไปใช้ต่อได้ทันทีทั้งในงานและชีวิตประจำวัน ไม่ใช่แค่ทฤษฎี
This custom workshop is designed to be delivered in-person or online, and can be tailored to the specific needs of the participants.

E-commerce Sales Analysis Dashboard
tap for details
E-commerce Sales Analysis Dashboard
ผู้บริหารแพลตฟอร์มอีคอมเมิร์ซเห็นยอดขายรวม แต่มองไม่เห็นว่าแบรนด์ หมวดหมู่ หรือวันไหนที่ขับเคลื่อนยอดขายจริงๆ
สร้าง Power BI Dashboard แบบหลายมุมมอง พร้อมวิเคราะห์เทรนด์ แยกตามเซกเมนต์ และ Heatmap ตามวันในสัปดาห์/วันที่
ผลลัพธ์:ให้ทีมมองเห็นข้อมูลเชิงลึกที่ใช้ตัดสินใจเรื่องแบรนด์ ช่องทาง และกลุ่มลูกค้าได้อย่างมั่นใจ
Includes advanced filters: Brand Rank, Channel, Category Level 2, Business Type, Age, and Segment.

Sales vs Target Performance Dashboard
tap for details
Sales vs Target Performance Dashboard
ผู้บริหารไม่สามารถเห็นแบบเรียลไทม์ว่าแบรนด์หรือสำนักงานขายไหนกำลังตามหลังเป้าหมาย จนกว่าจะสายเกินไปที่จะแก้ไข
สร้าง Power BI Dashboard ที่แสดงยอดขายจริงเทียบกับเป้าหมายแบบเคียงข้างกัน พร้อมวิเคราะห์เทรนด์
ผลลัพธ์:ให้ทีมผู้บริหารและทีมขายเห็นเซกเมนต์ที่ทำได้ต่ำกว่าเป้าตามแบรนด์ บริษัท และสำนักงาน และตอบสนองได้เร็วขึ้น
Filters include Brand, Company, and Sales Office for granular drill-down.

Market Pattern Analytics (ML Insight)
tap for details
Market Pattern Analytics (ML Insight)
การจับสัญญาณเริ่มต้นของการเคลื่อนไหวตลาดจากข้อมูลย้อนหลังจำนวนมากทำได้ช้าเกินไปสำหรับทีมที่ต้องตัดสินใจทันเวลา
สร้าง ML Pipeline ด้วย Random Forest ที่สแกนข้อมูล Time-series ของตลาดเพื่อหาแพทเทิร์นที่เกิดซ้ำ
ผลลัพธ์:ส่งมอบต้นแบบที่ใช้งานได้จริง ช่วยชี้โอกาสการลงทุนจากดัชนีย้อนหลังได้เร็วกว่าการรีวิวด้วยมือ
FMCG Brand Customer Analytics Dashboard
tap for details
FMCG Brand Customer Analytics Dashboard
แบรนด์ไม่รู้ว่าลูกค้ากลุ่มไหนที่สร้างรายได้ระยะยาวจริงๆ หรือความสัมพันธ์กับลูกค้าเหล่านั้นเปลี่ยนไปอย่างไรตามเวลา
สร้าง Power BI Dashboard ที่เน้นลูกค้าเป็นศูนย์กลาง ติดตาม Customer Lifetime Value อันดับลูกค้าหลัก และเทรนด์การเติบโต
ผลลัพธ์:ให้ลูกค้าข้อมูลที่ใช้วางกลยุทธ์รักษาลูกค้าแบบเจาะจงกลุ่ม และระบุกลุ่มลูกค้าที่มีมูลค่าสูงสุดได้

Executive Dashboard (Consulting Collaboration)
tap for details
Executive Dashboard (Consulting Collaboration)
ผู้บริหารระดับสูงมีตัวชี้วัดสำคัญกระจัดกระจายอยู่หลายแหล่งข้อมูล โดยไม่มีมุมมองเดียวที่ใช้ประกอบการตัดสินใจได้
ร่วมพัฒนา Power BI Dashboard ระดับผู้บริหารกับพาร์ทเนอร์ที่ปรึกษาระดับโลก รวม KPI ข้ามฟังก์ชันไว้ในมุมมองเดียว
ผลลัพธ์:ลดการพึ่งพาการรวบรวมรายงานด้วยมือ และเร่งความเร็วในการตัดสินใจของผู้บริหาร
Collaborated with the consulting partner's team to align dashboard design with enterprise reporting standards.

Booking Insight LLM
tap for details
Booking Insight LLM
ผู้บริหารมีชื่อการจองห้องประชุมกว่า 45,000 รายการ แต่ไม่มีวิธีมองเห็นว่าข้อมูลเหล่านั้นบอกอะไรเกี่ยวกับกิจกรรมทางธุรกิจจริง
สร้างเครื่องมือวิเคราะห์ด้วย Claude API ที่อ่านชื่อการจองห้องประชุมทั้งหมดและดึงแพทเทิร์นออกมาโดยไม่ต้องรีวิวด้วยมือ
ผลลัพธ์:ค้นพบจุดโฟกัสเชิงกลยุทธ์และคำแนะนำการใช้ห้องประชุมที่ปกติต้องใช้เวลารีวิวด้วยมือหลายสัปดาห์

Luxury Wellness Brand Sales Dashboard Revamp
tap for details
Luxury Wellness Brand Sales Dashboard Revamp
แพลตฟอร์มรายงานยอดขายเดิมของแบรนด์ทำงานช้าและอ่านยาก จนผู้มีส่วนเกี่ยวข้องเริ่มไม่เชื่อถือข้อมูล
ทำ Reverse-engineer โมเดลข้อมูลเดิม แล้วสร้างระบบรายงานใหม่เป็น Power BI Dashboard ที่ทันสมัยและสอดคล้องกัน
ผลลัพธ์:เพิ่มการใช้งานจริงของผู้มีส่วนเกี่ยวข้อง และลดเวลาที่ใช้ดึงข้อมูลเชิงลึกด้านยอดขายค้าปลีก
Legacy system migration; required reverse-engineering of existing data models before redesign.

Petrochemical Conglomerate Sales & Marketing Dashboard
tap for details
Petrochemical Conglomerate Sales & Marketing Dashboard
ข้อมูลขายและการตลาดแยกกันอยู่คนละระบบ ทำให้ทีมงานในกลุ่มบริษัทปิโตรเคมีรายใหญ่ของไทยมองไม่เห็นภาพผลงานรวมกัน
สร้าง Tableau Dashboard ที่รวมข้อมูลขายและการตลาดเข้าไว้ในมุมมองเดียวข้ามแผนก
ผลลัพธ์:ให้ทีมมองเห็นโอกาสทางการตลาดและติดตามผลงานเชิงพาณิชย์ข้ามสายผลิตภัณฑ์ได้จากรายงานเดียว

Food Production Group Process Analysis
tap for details
Food Production Group Process Analysis
ทีมปฏิบัติการของกลุ่มผลิตอาหารมองไม่เห็นว่าคอขวดจุดไหนที่ทำให้กำลังการผลิตช้าลง
สร้าง Tableau Dashboard วิเคราะห์ขั้นตอนการผลิตและตัวชี้วัดประสิทธิภาพกระบวนการ
ผลลัพธ์:ช่วยทีมปฏิบัติการชี้จุดที่ไม่มีประสิทธิภาพ และใช้ข้อมูลสนับสนุนการปรับปรุงกำลังการผลิตและการใช้ทรัพยากร

Insurance Group Digital Marketing Report Transformation
tap for details
Insurance Group Digital Marketing Report Transformation
ทีมการตลาดต้องสร้างรายงานแบบเดิมซ้ำๆ ด้วยมือใน Spreadsheet ทุกรอบการรายงาน
แทนที่รายงาน Spreadsheet แบบ Static ด้วยเครื่องมือ BI บน Tableau ที่เป็น Self-service และเชื่อมข้อมูลผ่าน Pipeline โดยตรง
ผลลัพธ์:ตัดขั้นตอนการทำรายงานด้วยมือออกไปทั้งหมด และให้ทีมการตลาดเข้าถึงผลงานแคมเปญและช่องทางแบบเรียลไทม์
Included designing a data pipeline to connect marketing platform exports directly into Tableau.
NEXT_STEP // 0x6e657874